165,000 lines of cybersecurity platform, one operator, twelve specialist roles.
Every figure on this site comes from one product. This is that product: what it does, the constraint that decided its architecture, how it was delivered, and the parts of the record we would rather not print.
Start with the thing you were about to think anyway. This is our own product, not a client engagement — we wrote the requirements as well as met them. What that does and does not prove is set out at the foot of the page, and it is worth reading before you weigh anything above it.
A scanner tells you a finding exists. This answers what it means here.
The product is a knowledge graph of a security estate. Assets, the vulnerabilities published against them, the detections that would catch an attempt to use one, and the countermeasures already deployed are held as one connected structure rather than four disconnected tools, so a question about any of them can be answered in terms of the others.
That changes what a security team can ask. Not “how many criticals do we have” — a number nobody can act on — but whether a new advisory reaches machines that actually exist here, which of the controls already running would see it, and what is left once you subtract those. A finding stops being an item in a queue and becomes a statement about one real estate.
We do not publish how large the graph is. The node and edge counts size the asset closely enough to tell a competitor what rebuilding it would cost them, so they stay out of public material — including this page.
It links four things that normally sit apart
It answers in terms of your estate
It runs on models we host
No external AI API. That rules out most of the obvious architecture.
A security estate is the one dataset an organisation will not post to a third party: it is a map of where they are weakest. So the product had to run inside the customer’s own infrastructure, with no call to a hosted model and no managed service in the answer path.
That single line deletes the architecture most teams would reach for. No frontier model doing the reasoning, no hosted vector service, no provider whose terms you have to read. What remains is smaller models running locally — and a set of consequences you inherit whether you planned for them or not.
The strongest models were not available to us
The graph carries what the model cannot
Offline is a build problem, not only a runtime one
The honest reading: this is the slower way to build. With a hosted frontier model in the loop, several parts would have taken less time and some answers would probably be better today. The constraint bought deployability in environments that would otherwise be closed, and it was paid for in engineering.
Four steps on a loop, and six checks a change has to clear.
This is the same process every client engagement runs on — the product was built on it, which is why we are willing to describe it in this much detail.
Understand
We read your problem — or your existing system — into a map of what it is, what depends on what, and where the gaps are. You get a plan you can challenge before anything is built.
Build
The work is split into small, tracked items with agreed acceptance criteria and assigned to the right specialist. Every change is isolated and reviewed.
Prove
Six checks run before anything reaches your product — ending with whether a real person can finish the job on the running system.
Report
Progress, quality and cost are recorded as the work happens. One live board, always current. Blocked work shows the day it blocks.
Every item was assigned to a role with its own scope and its own definition of done, never to a general-purpose prompt. Twelve of them worked on this product, under one accountable person:
| # | Check | What it established on this build | Runs |
|---|---|---|---|
| 01 | Security and code health | Insecure code, leaked credentials and unreadable work stopped at the door. | every change |
| 02 | Automated tests | Every change proved against the test suite — and the bar rises as your product grows. | every change |
| 03 | Integration | Confirms the parts still work together, not just on their own. | on integration |
| 04 | Whole system | Rebuilds everything from scratch and scans the full stack for vulnerabilities. | on integration |
| 05 | AI output quality | What the AI produced is sampled and scored. Nothing is assumed. | before release |
| 06 | Real user journey | Can a real person finish the job, end to end, on the running system. | before release |
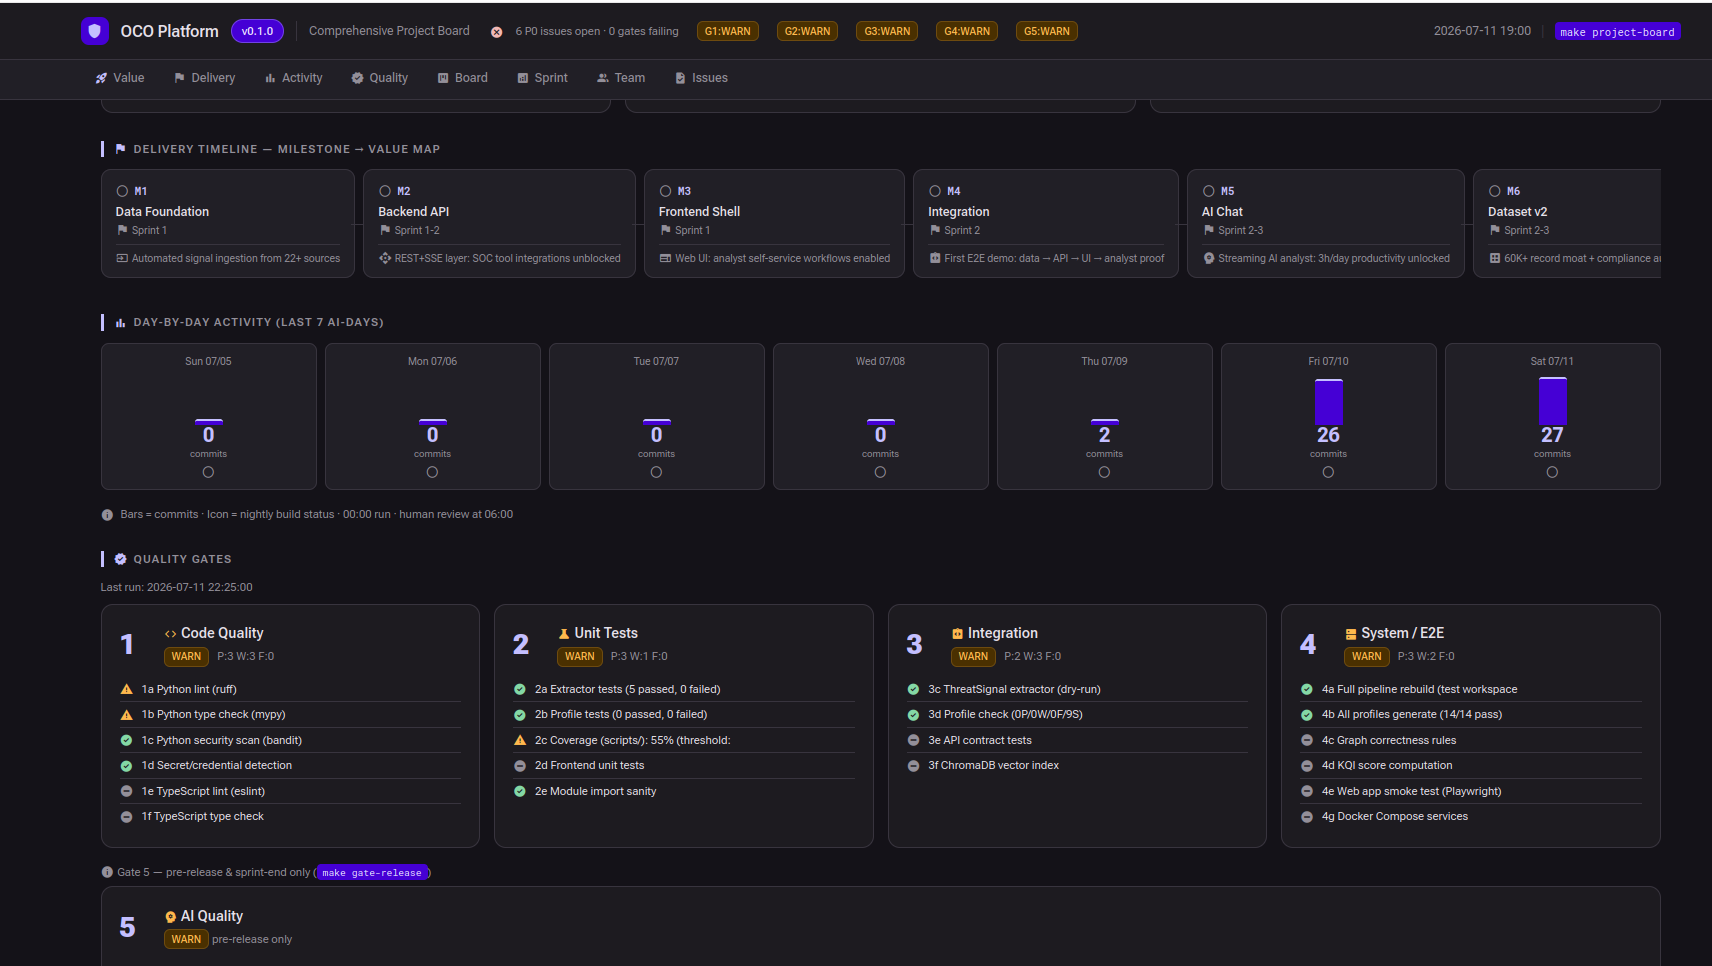
Read out of the work record, including the rows that do not flatter us.
Position as at 2 August 2026, recomputed from the record rather than typed into a slide. These are a dated capture, not a live feed. The board they come from keeps running, and the figures move with it — up and down.
| Measure | This build | Typical for comparable work | Read |
|---|---|---|---|
| Work delivered as committed | 94–96% | 60–85% | Better |
| Time actually spent working | 28% | 10–20% | Better |
| Test coverage | 80% | 70–80% target | In line |
| Defects per 1,000 lines | 2.64 | 1–5 for a disciplined team | In line |
| Effort to reach this scope | ≈ 1 person-month | ~200 person-months | Far lower |
| Calendar time to reach it | 17 days | 9–18 months | Far lower |
| Work later redone | 43% | no published norm | Watch item |
"Typical" means commonly published software-engineering ranges for work of comparable scope. The effort and calendar rows are an order-of-magnitude estimate, not a precise measurement — shown with that caveat rather than without it.
43% of the work on this product was later redone. That is the highest number on the board and it has no published norm to hide behind, so we cannot tell you whether it is good. We can tell you it is measured, on its own line, rather than absorbed into a total where nobody would ever find it.
Time lost to queueing rose sharply as more work ran in parallel. Running more items at once made the average item slower to finish — which is the opposite of what the parallelism was for, and it is still on the board today.
Every test was green. The product was broken.
Part-way through this build the suite passed, coverage was above eighty per cent, and every check reported success. Two screens were failing to load, and of nine journeys a customer might want to complete, one could be completed end to end.
Nothing was faulty about the tests. A test encodes an expectation, and an expectation is something a person had; the failures that hurt are the ones nobody thought of, which is precisely the set no test covers. We had been reading a green board as evidence of a working product, and those are different claims.
The sixth check exists because of that week. It asks whether a real person can finish the job on the running system — the one question that cannot be satisfied by writing more code to satisfy it.
Four changes we made from this build, and would make from day one on the next.
Put rework on the board in week one
Cap how much runs at once
Run a thin journey check at integration
Plan the offline packaging with the first architecture
We set the requirements as well as met them, so discount it accordingly.
This is our own product. No client changed their mind in the middle of a sprint, no third party was late, no stakeholder had to be talked round, and when a requirement proved expensive we were free to move it. A large share of what makes commercial delivery slow was simply absent, and the calendar figure above reflects that as much as it reflects the process.
The quality figures are counted by us, from our own board, against our own definition of a defect. Nobody external has audited them. The comparison table is an order-of-magnitude reading against published ranges, not a controlled trial — one product, one domain, one operator, which makes it an existence proof rather than a distribution you can plan against.
What it does show is narrower and still worth something: a gated process ran to this scope, the record survived being published with its worst rows intact, and the same board and the same checks are what an engagement is delivered on. Whether that transfers to your codebase is a different question, and the honest way to answer it is to point the process at one of your systems and see.
Point it at one of your systems.
Give us read access to a single service or repository. We map what it is, what depends on what and where the gaps are, then write up what we found — what we would build, what we would not, and what we are assuming. About a week, no charge, and the assessment is yours whether or not we go further.
Talk to us